Check Basic CPU Temperature with Core Temp
The most important temperature to measure in your computer is the processor or CPU. Core Temp is a lightweight and simple application that runs in the system tray, controlling the CPU temperature without confusing other tools. Core Temp offers a few other options for you to customize to your liking and can even work with other programs like Rainmeter.
When running, it will appear as an icon or a series of icons in the system tray showing the CPU temperature. If the CPU has multiple cores (like modern CPUs), it will display multiple icons - one for each core.
Right-click the icon to show or hide the main window. This will give you a bunch of information about the CPU, including the model, speed, and temperature of each core.
Special note: "TJ. Max" is the highest temperature (in degrees Celsius) that the manufacturer has set for your CPU to run at. If your CPU gets close to that temperature, it is considered overheating. (It's usually best to keep it 10 to 20 degrees below the recommended temperature. If your CPU even gets close to that temperature, something is wrong unless you're overclocking your CPU.)
For most modern CPUs, Core Temp can detect the Tj. Max for your specific processor, but you should look up your specific processor online and check it carefully. Every processor is a little different, and an accurate Tj. Max value is important, as it ensures you're getting accurate temperature readings for your CPU on your computer.
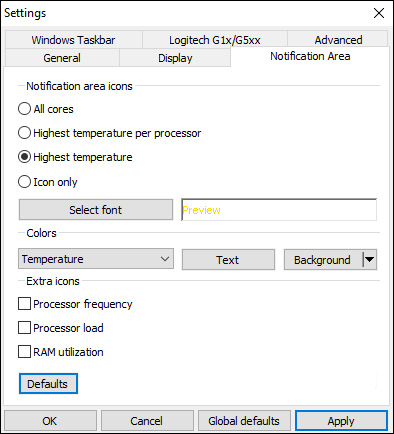
Go to Options > Settings to configure some of Core Temp's useful features. Here are a few settings we recommend you consider:
General > Start Core Temp with Windows: This can be turned on or off at will. If enabled, it allows you to monitor your computer's CPU temperature at all times without having to launch the application. However, if you only need to use the app occasionally, you can disable this feature.
Display > Start Core Temp minimized: You'll probably want to enable this if you have "Start Core Temp with Windows" enabled.
Display > Hide Taskbar Button: If you always have the app running on your computer, enabling this feature will avoid wasting space on your taskbar.
Notification Area > Notification Area Icons: This lets you customize how Core Temp appears in the notification area (or system tray, as it's often called). You can choose to show just the app's icon, or show the CPU temperature - I recommend "Highest temperature" (rather than "All cores", which will show multiple icons). You can also customize the font and color here.
If the icon only appears in the pop-up tray and you want to see it all the time, just click and drag it onto the taskbar.
If you decide to display the temperature in the notification area, you may want to change the Temperature Polling Interval in the General tab of Core Temp settings. By default, it is set to 1000 milliseconds, but you can change it higher if the flashing number is annoying you. Remember, the higher the value you set, the longer it takes for Core Temp to notify you, which is not good if your CPU is overheating.
Core Temp can do more - you can select Options > Overheat Protection to have your computer tell you when it has reached the maximum safe temperature. These basics are all you need to know to monitor the CPU temperature on your computer.
Monitor Your Whole System Temperatures with HWMonitor
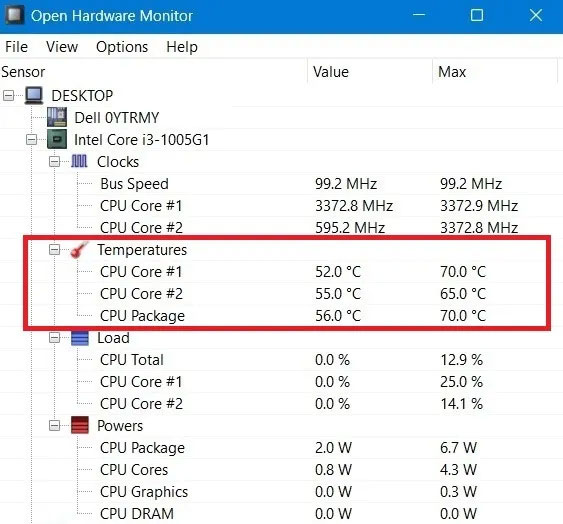
Usually, the CPU temperature on your computer will be the most important temperature to monitor. However, if you want to see the temperatures on your motherboard, CPU, graphics card and hard drives - HWMonitor will give you that and more.
Download the latest version of HWMonitor. I recommend the ZIP version, which requires no installation, but you can of course download the full installer version if you want. Launch it and you will be greeted with a table of temperatures, fan speeds and other values.
Download the latest version from the HWMonitor homepage
To find the CPU temperature, scroll down to the CPU section, for example "Intel Core i7 4930K" - and look for the "Core #" temperature in the list.
(Note that “Core Temperature” is different than “CPU Temperature,” which will appear under the motherboard on some PCs. In general, you’ll want to monitor the core temperature. See our note on AMD temperatures below for more information.)
Click the items next to it yourself and see the temperatures of other components in your system. There’s not much you can do with HWMonitor, but it’s a good program for viewing other temperatures besides the CPU temperature.
Use Ryzen Master to Check CPU Temperature (AMD Ryzen CPUs Only)
This method may only apply to those lucky enough to own a Ryzen CPU. If you’re in that group, it’s the most accurate way to monitor your CPU temperature, as it uses AMD’s proprietary method for reading CPU temperatures that other CPU monitoring software doesn’t have access to.
Additionally, Ryzen Master is widely used as an overclocking utility, making reading CPU temperatures even more important.
You can download the tool online from AMD's official site. To use it, open the application to view the temperature. It can be compared to the maximum temperature limit supported by your processor.
Use Throttlestop to Check CPU Temperatures
The lightweight Throttlestop tool allows you to reduce the voltage to your CPU to lower the temperature and prevent throttling, thereby allowing your CPU to operate more efficiently.
You should consider undervolting if you want to cool your CPU, but as an added feature, you can also use Throttlestop as a CPU temperature monitor.
You can see each individual core temperature in the main Throttlestop window.
You can also make your CPU temperature appear in the notification area on your PC. To do this, click Options at the bottom of Throttlestop, then in the middle, check the CPU Temp box. Now, every time you open Throttlestop, you'll see a small number in the notification area on your taskbar showing your CPU temperature at that moment.
Using HWinFO to Check CPU Temperature
HWinFO is one of the most comprehensive free Windows diagnostic software. It supports the full range of Intel processors, from Xeon/Atom to Core i9, as well as most AMD processors except the latest Ryzen series. HWinFO offers great graphical visualization features to warn you when your computer is overheating.
Although there is a Pro and portable version of HWinFO, you will get a lot of valuable information from the free download installer.
After launching the dashboard, navigate to the Sensors tab. The software will display a warning message because it uses the EC (Embedded Controller) sensor on your motherboard. It is safe to disable this warning as you will temporarily experience a slight performance lag.
Check the temperature values for different CPU cores in the Sensors status reading.
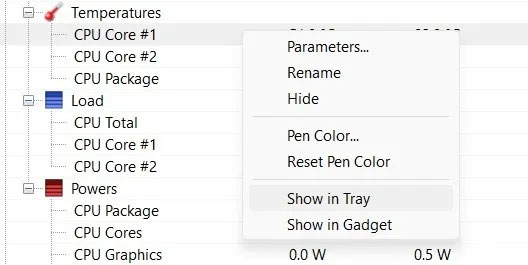
With a right-click, you can add these temperature values to the system tray. If you want to monitor the temperature increase of the CPU over time, click Show Graph. A graph to monitor the temperature level of the CPU will appear. Any unexpected increase in temperature (during gaming or using heavy applications) will cause a spike.
Use MSI Afterburner to Check CPU Temperature
Designed for gamers and for those who like to overclock their PC, MSI Afterburner serves as a great tool to monitor the temperature of your PC. Note that MSI Afterburner doesn’t work well with all CPUs and is known to not show temperatures for AMD CPUs in particular.
After installing and opening Afterburner, you’ll see a graph on the main screen showing GPU temperature, CPU temperature, and more.
If you don’t see the temperature option, your CPU may not be supported, but there’s still hope! Open the app’s properties from the Settings icon. In the Monitoring tab, click the three-dot menu icon below.
You’ll see a list of plugins and can link MSI Afterburner to another tool that monitors CPU temperatures or check the “CPU.dll” option to get the CPU temperature.
To rearrange the graphs and prioritize the CPU temperature so that it appears near the top, click Settings in Afterburner, then click the Monitoring tab. You’ll see a menu where you can check the ones you want to show on the main screen and drag the ones you want to appear near the top to the top.
Drag CPU1 temperature, CPU2 temperature, and all other CPU temperatures near the top of the graph and click OK. They’ll appear on the main screen in the order you chose.
After selecting the CPU temperature, you can also check the Show in LCD Display box so that it appears in the corner whenever you enter a shortcut to bring up the OSD. (You can choose which keys you want by going to the Profiles tab in Afterburner’s settings.)
Using AIDA64 Extreme to Check CPU Temperature
AIDA64 Extreme is another all-in-one diagnostic software that focuses specifically on CPU temperature values. There is a trial and evaluation version, free for 30 days. In addition to Windows, AIDA64 Extreme also supports Ubuntu, iOS, Google Play, and other operating systems.
AIDA64 Extreme software supports both Intel Core 13000 and AMD Ryzen 7000 series processors. It is one of the best system tools on the market for the latest GPUs, RAM, and SSDs.
Once you can see the AIDA64 Extreme main screen, click on Computer > Sensor.
In Sensor, you can see various sensor properties including CPU temperature, CPU package temperature, CPU IA Core temperature, and CPU GT Core temperature. But due to the use of sensors, the CPU temperature increases very quickly. Do not let the processor overheat for a long time.
- Are you looking at the right sensor? If the two programs report different temperatures - especially on AMD machines - it could be that one program reports the Core temperature and the other the CPU temperature. Make sure you are comparing the correct temperature, the Core temperature is the one to worry about.
- Make sure your programs are up to date. If you are using an older version of Core Temperature, it may not support your CPU, in which case it will not provide accurate temperatures (or not provide temperature information at all). Download the latest version to see if that fixes the problem. If you have a very new CPU model, you may have to wait for a program update.
- How old is your computer? If it's more than a few years old, it may not be supported by programs like Core Temp.


No comments:
Post a Comment